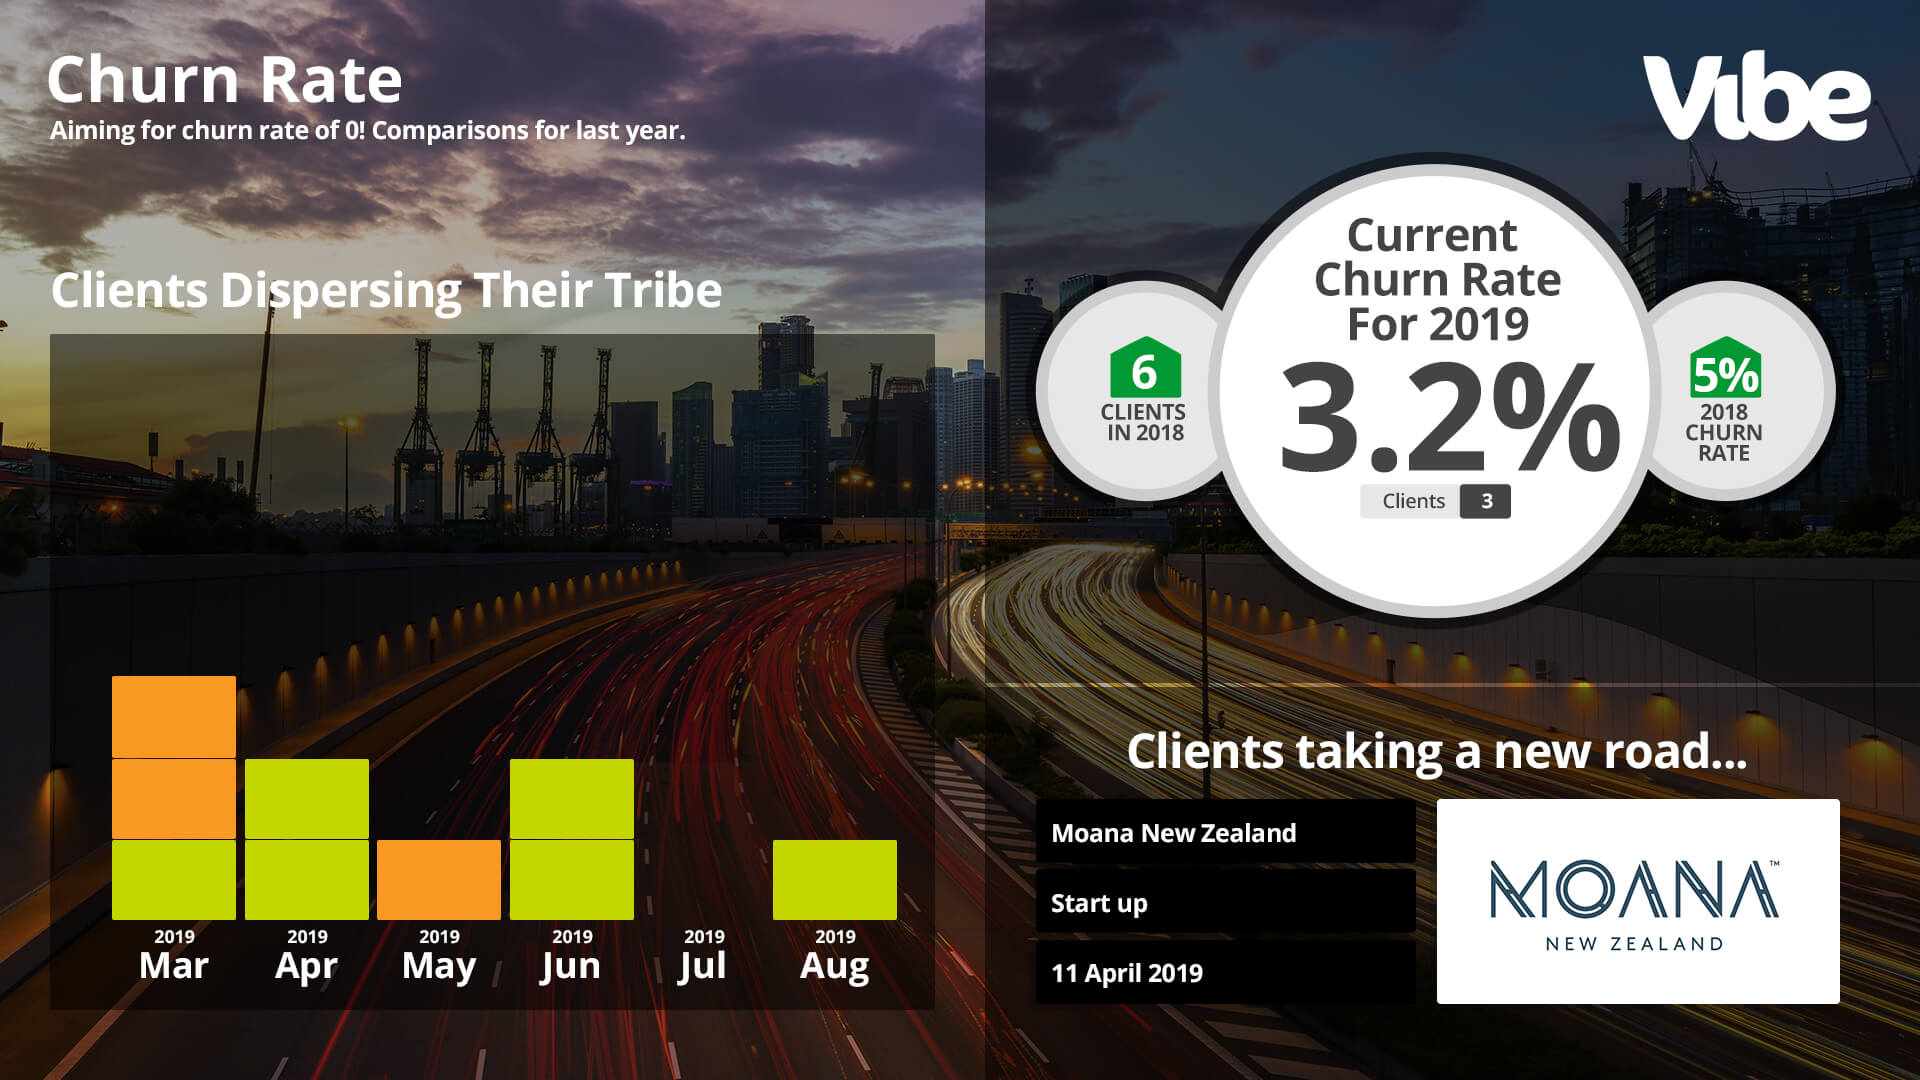
Graph Churn
Let the Graph Churn slide visually demonstrate your churn rate, month by month, category by category.
Colour coded blocks separate segments to make the data easy to understand on first glance. Highlight your important data, show comparisons
from one month to the next, and welcome or farewell new clients to the business. Colour code the slide to match your company theme, with the
addition of graphics or logos to create more visual interest.
Content types
- Vibe Portal (Web-based list items)
- Sharepoint
- File Upload
- Google Sheets

Fully optimised for communication
Landscape and portrait commercial screens,
Chrome browser, Screensaver and Mobile devices